|
<< Click to Display Table of Contents >> Viewing the Event and Call Logs |
  
|
|
<< Click to Display Table of Contents >> Viewing the Event and Call Logs |
|
The Call Log
The Call Log will record events for all of the shared COM ports, and will contain the following fields:
| • | Start Time - The date and time the call was initiated. |
| • | Duration - The length of the call. |
| • | Status of the call attempt. |
| • | Phone Number. |
| • | User (if known). |
| • | Server IP Address. |
| • | Port Group used to access the COM port. |
| • | COM Port used. |
| • | Client IP Address. |
| • | Call Type - Either Data or Fax. |
| • | Bytes Sent - The number of bytes sent. |
| • | Bytes Received - The number of bytes received. |
To view the Call Log, open the TacServe Tool and expand it in the console tree. Then click Calls.
To disable call logging, open the TacServe tool and expand it. Then click Port Groups. In the Action menu, click Properties. In the General tab, select or clear the Disable dialing restrictions and call logging checkbox. Then click OK or Apply.
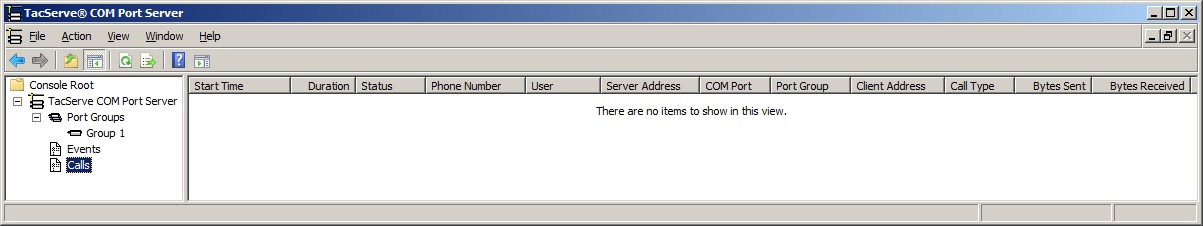
The TacServe Calls Log
The Event Log
To view the Event Log, open the TacServe Tool and expand it in the console tree. Then click Events.
The Event Log will record events for all of the shared COM ports, and will contain the following fields:
| • | Timestamp. |
| • | Client Address. |
| • | Port Group. |
| • | COM Port. |
| • | Event - See list below. |
| • | User - Appears for all events once a login is successful. If no login was performed during the session, then the User column will be blank. |
| • | Duration - Appears for all RESET and CLOSE events. |
| • | Phone Number - Appears for the DIAL and CLOSE events. If no dialing is detected during the session, then the CLOSE event will have a blank Phone Number. |
| • | Comment. |
The following is a list of the Events:
| • | OPEN - A new session has started and the COM port has been opened. |
| • | LOGIN - The user login was successful. |
| • | DIAL - A modem dial attempt was detected and allowed. |
| • | CLOSE - The session has ended and the COM port has been closed. |
| • | FAIL - Failure with the reason indicated in the Comment column. |
| • | RESET - The session has been reset by a Reset in the TacServe Tool. |
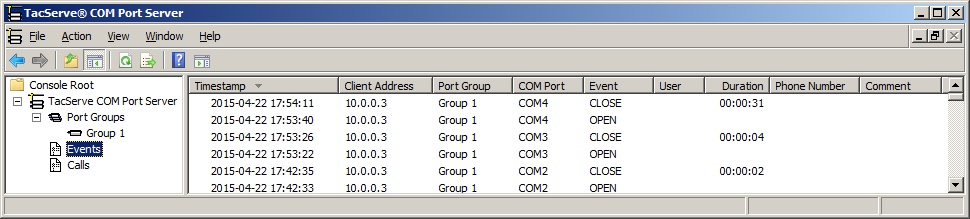
The TacServe Events Log
Using the Logs
To adjust the log's display, click on any column header to sort the display. Clicking again will invert the sort order, with Timestamp as a secondary sort in the same direction.
To write the log data to a text file, in the Action menu, click Export List.
To clear the log database, in the Action menu, click Clear Log and then OK.
The columns that appear in the details panel may be customized by using the Add/Remove Columns command in the View menu.
The logs will record events for all of the shared COM ports. However, the display will not be automatically updated. To update the display to reflect the latest data, in the Action menu, click Refresh.
Database Information and Repair
The Call Log and Event Log data are stored in a Microsoft Access database with an ODBC interface. Therefore, log data is readily available in a live display to any Windows program that supports ODBC data sources.
To facilitate post-processing of the log data, TacServe will install an ODBC data source by using the Microsoft Access driver. The data source contains two tables, an Event Log table and a Call Log table. The TacServe data source appears in the System DSN tab of the OBDC Data Source Administrator tool, and is available via Windows Administrative Tools.
If an operation against the database results in an error, then TacServe will issue a database repair request to the ODBC driver. If the repair succeeds, then a warning will be logged into the TacServe Event Log and the Windows Event Log.
If the TacServe repair attempt does not succeed, an error message will be sent to the Windows Event Log. Events and Calls will stop being added to the TacServe log database. If the TacServe general option Refuse new sessions if logging fails is selected, then new connections will not be accepted. The TacServe Calls and Events nodes in the console tree will be marked with a red line-through-circle icon. Selecting either the Calls or Events nodes will no longer show the data, but instead will display an error message. These conditions will remain until TacServe is restarted.
If the automatic repair fails, then a manual repair is recommended. During this process, the tool can display detailed feedback on errors, causes, and possible solutions. These are all tailored for the version of the database driver that is being used.
To conduct a manual repair, stop any application which may be accessing the ODBC data source. Under Administrative Tools, choose Data Sources (ODBC). Click the System DSN tab, and then select the TacServe data source. Click Configure, and then the ODBC Microsoft Access Setup window will appear. Click Repair.
If the repair operation does not succeed, then the log database must be replaced. In the Windows Control Panel, open Programs and Features. Click the TacServe entry. Click Repair, which will create an empty database file, and then restart the TacServe service.