|
<< Click to Display Table of Contents >> The Port Monitor |
  
|
|
<< Click to Display Table of Contents >> The Port Monitor |
|
The COM/IP Port Monitor program is used to view and capture session data for analysis and troubleshooting.
Using the Port Monitor
The COM/IP Port Monitor window
The COM/IP Port Monitor can be opened by three ways: By double-clicking the COM/IP icon in the Windows System Tray; or by right-clicking the COM/IP icon in the Windows System Tray and choosing the Port Monitor; or by clicking Port Monitor in the COM/IP Control Panel.
Multiple Port Monitor windows may be opened simultaneously and configured separately.
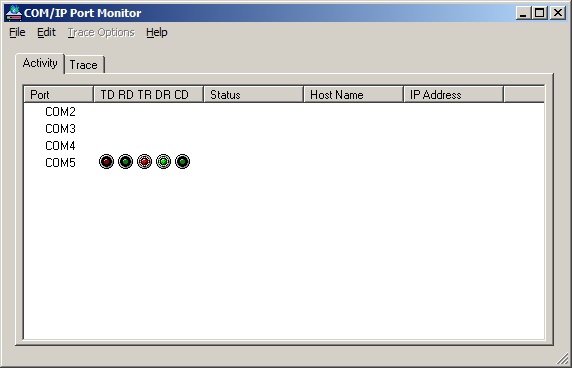
The Activity Panel will provide a display of the status of all COM/IP COM ports.
The Port is the virtual COM port number label for the row, which will always appear.
The Line signal indicators are:
| • | TD indicates that data is being sent to the server. |
| • | RD indicates that data is being received from the server. |
| • | TR (DTR) is the signal from the application to the server that indicates the application has opened the virtual COM port. The most common use of DTR is to lower the signal to tell the modem to disconnect. |
| • | DR (DSR) is the signal from the server to the application that indicates when a modem or serial device is connected to the server, and is ready to communicate. |
| • | CD (DCD) is the signal from the server to the application that indicates when a modem has successfully negotiated a connection with another device. |
The line signal indicators will only appear when the virtual COM port is in use.
Trace Log
The COM/IP Trace window
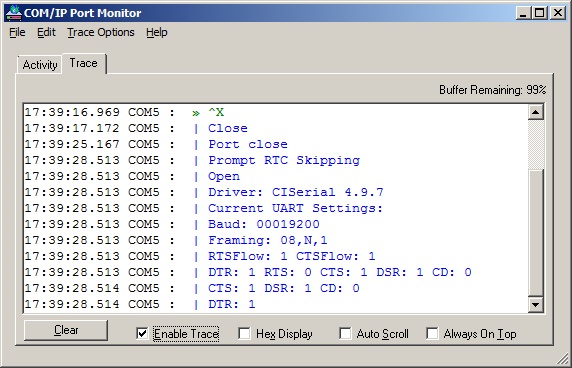
The Trace Log will provide a detailed, time-stamped display of all COM/IP COM port operations. When enabled, the display will be updated every one second.
This feature can be used to debug application issues. The Trace Log feature will have some impact on memory usage and system performance, so it is typically only enabled temporarily.
Data that appears in the Trace Log may be copied to the clipboard, or saved to a file for off-line analysis.
Using the Trace Log
Open a new Port Monitor window, and click the Trace tab. Select the Enable Trace checkbox. Then start the application that uses COM/IP COM ports, and recreate the issue that is being debugged.
To save the trace data to a file for off-line analysis, use the File | Save As menu command. This file uses a binary format that preserves all data, and may be opened later in a Trace Window by using the File | Open menu command.
To capture the trace data in text format and copy it to the Windows clipboard, use the Edit | Copy menu command. The text may be pasted into other Windows applications.
Configuring the Trace Window
Clicking Clear removes all data from the display, and resets the trace data collection mechanism.
Selecting Enable Trace starts the trace data collection and display.
Hex Display toggles the format of the display between ASCII and hexadecimal format.
Auto Scroll displays the most recent trace data continuously.
Always on Top keeps the Trace Window on top of other application windows.
Using the Trace Options menu
Select Ports to Capture reduces the number of ports that are being traced, to a subset of all configured virtual COM ports. For applications that use a large number of COM ports, this feature will reduce the impact of tracing on memory and system performance.
Select Ports to Display reduces the number of ports that will appear in the display, to a subset of the ports being captured. For applications that use a large number of COM ports, this feature will provide a way to focus on ports of interest amongst all of those being captured.
Buffer Size changes the amount of system RAM being used for tracing.
System Debug Output sends trace data to the system debug channel, with an optional label.
Transmit events is the data that is written to the virtual COM port. It is shown in green and is preceded by a "»" character.
Receive events is the data that is read from the virtual COM port. It is shown in red and is preceded by a "«" character.
Control events show the setting of session parameters (such as Telnet), opening and closing of a port, connecting to the server, setting a device control or status line (DTR, DSR, DCD, etc.), and the configuration of baud rate and framing parameters. They are shown in blue and are preceded by a "|" character.